Excel FREQUENCY Function
Summary
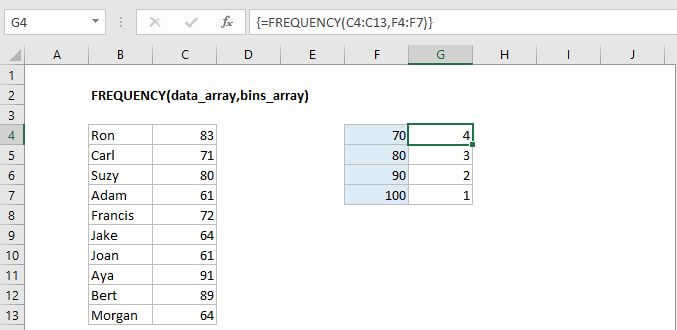
The Excel FREQUENCY function returns a frequency distribution, which is a summary table that shows the frequency of each value in a range. FREQUENCY returns multiple values and must be entered as an array formula with control-shift-enter.
Purpose
Get the frequency of values in a data set
Return value
A vertical array of frequencies
Syntax
=FREQUENCY (data_array, bins_array)
Arguments
- data_array - An array of values for which you want to get frequencies.
- bins_array - An array of intervals ("bins") for grouping values.
Usage notes
FREQUENCY counts how often values occur in a set of data. You can use Excel's FREQUENCY function to create a frequency distribution - a summary table that shows the frequency (count) of each value in a range. It returns a vertical array of numbers that represent frequencies, and must be entered as an array formula with control + shift + enter.
For example, with data in A1:A100, and bins in B1:B5, you would select C1:C5 and enter a formula like this:
{=FREQUENCY(A1:A100,B1:B5)}Curly braces added by Excel automatically when formula is array-entered.
Notes:
- FREQUENCY returns multiple values and must be entered as an array formula with control-shift-enter.
- FREQUENCY always returns an array with one more item than the bins_array. This is by design, to catch any values greater than the largest interval in the bins_array.
- Each bin shows a count of values up to and including bin value, excluding values already accounted for
To create a frequency distribution using FREQUENCY:
- Enter numbers that represent the bins you want to group values into
- Make a selection the same size as the range that contains bins, or one greater if want to include the extra item
- Enter the FREQUENCY function as an array formula using Control+Shift+Enter