Excel PERCENTRANK.EXC Function
Summary
The Excel PERCENTRANK.EXC function returns the relative rank of a value in a data set as a percentage representing how many values are less than or equal to the value. Percentile rank is commonly used as a way to interpret standing in standardized tests.
Purpose
Get percentile rank, exclusive
Return value
Calculated rank as a decimal value
Syntax
=PERCENTRANK.EXC (array, x, [significance])
Arguments
- array - Array of data values.
- x - Value to rank.
- significance - [optional] Number of significant digits in result. Defaults to 3.
Usage notes
The Excel PERCENTRANK.INC returns the relative standing of a value within a data set as a percentage. For example, a test score greater than or equal to 80% of all test scores is said to be at the 80th percentile.
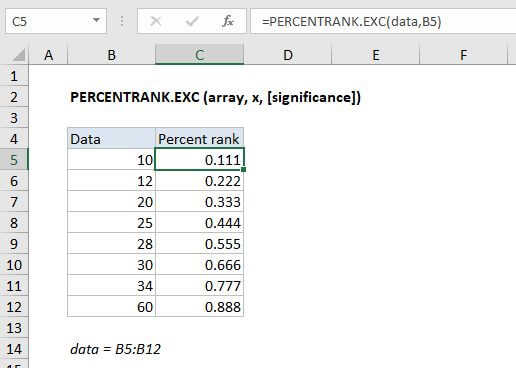
In the example shown, the formula in C5 is:
=PERCENTRANK.EXC(data,B5)
where "data" is the named range C5:C12.
Interpolation
When x does not exist within the array, the function interpolates a value between data points. For example, when the x value of 4.00 is passed as an argument to the function, the percentage is interpolated to the value %44.4, which lies between the percent rank of 3.3 and 4.56 which are %37.5 and %50.0 respectively.
In the graph below, solid orange dots represents x values that are contained within the input array, while the outlined orange dots are values that are interpolated.
Inclusive vs. Exclusive
Starting with Excel 2010, the PERCENTRANK function has been replaced by two functions: PERECENTRANK.INC and PERECENTRANK.EXC. The INC version represents "inclusive" behavior, and the EXC version represents "exclusive" behavior. Both formulas use the same arguments.
- Use the PERCENTRANK.EXC function to determine the percentage rank exclusive of the first and last values in the array.
- Use the PERCENTRANK.INC or PERCENTRANK to find the percentage rank inclusive of the first and last values in the array.
The screen below shows differences with a small data set:
As the size of the input array increases, the difference between the two functions decreases. The difference between the returned percentages will never be larger than 1/(N+1), where N is the size of the input array.
Notes
- If x does not exist in the array, PERCENTRANK.EXC interpolates to find the percentage rank.
- When significance is omitted PERCENTRANK.EXC returns three significant digits (0.xxx)