Excel STDEVA Function
Summary
The Excel STDEVA function calculates standard deviation for a sample of data. Unlike the STDEV function, STDEVA will evaluate text and logicals that appear in references. To calculate standard deviation for an entire population, use STDEVPA or STDEV.P.
Purpose
Get standard deviation in a sample
Return value
Estimated standard deviation
Syntax
=STDEVA (number1, [number2], ...)
Arguments
- number1 - First number or reference in the sample.
- number2 - [optional] Second number or reference.
Usage notes
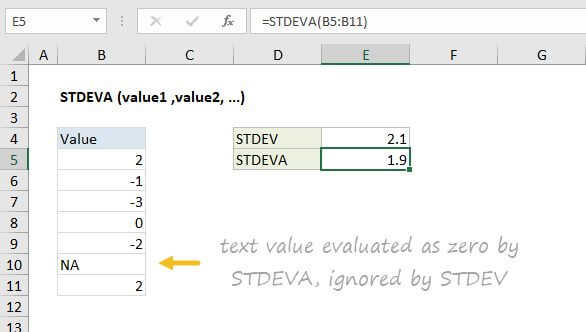
The STDEVA function calculates the standard deviation for a sample set of data, evaluating text and logicals as numbers as part of the calculation. TEXT is evaluated as zero, TRUE is evaluated as 1, and FALSE is evaluated as zero.
Standard deviation is a measure of how much variance there is in a set of numbers compared to the average (mean) of the numbers. The STDEVA function is meant to estimate standard deviation in a sample. If data represents an entire population, use the STDEVPA function.
In the example shown, the formula in E5 is:
=STDEVA(B5:B11)
Standard Deviation functions in Excel
The table below summarizes the standard deviation functions provided by Excel.
| Name | Data set | Text and logicals |
|---|---|---|
| STDEV | Sample | Ignored |
| STDEVP | Population | Ignored |
| STDEV.S | Sample | Ignored |
| STDEV.P | Population | Ignored |
| STDEVA | Sample | Evaluated |
| STDEVPA | Population | Evaluated |
Notes
- Only use STDEVA when you need to evaluate logicals or text in the standard deviation calculation.
- STDEVA calculates standard deviation using the "n-1" method.
- STDEVA assumes data is a sample. If data representations an entire population, use STDEVP or STDEV.P.
- Values are supplied as arguments. They can be supplied as actual numbers, ranges, arrays, or references that contain numbers.
- STDEVA evaluates logical values and/or numbers in supplied references. To ignore these values use STDEV or STDEV.S